-
 Studios
-
 Support
-
 Contact us
-
 Products
![]() Studios
Studios
The GUL Monitoring System uses a transducer ring (like those used in GUL Screening) that has been designed to be permanently installed on the pipe. In addition to the sensor, the monitoring system comprises electronics to generate the waves that are used to monitor the pipe, and software to analyse and visualize the data that is collected.
GUL Monitoring and GUL Screening both use ultrasonic guided waves that travel along the length of the pipe and are reflected from pipe features. The monitoring approach adopted by the GUL Monitoring System differs from the screening approach in that instead of moving the inspection apparatus from one location to another along a pipe, a single location is chosen (usually a location that is of particularly susceptible to corrosion) and the gPIMS® monitoring sensor is permanently installed at this location. Data can then be collected from this sensor as often as required, and can be compared over time to detect corrosion activity with greater sensitivity than with a screening approach.
The GUL Monitoring System provides a great deal of information about the pipeline. These different information types can be thought of as follows:
Monitoring the condition of a pipeline provides assurance about the integrity of the asset, demonstrating on an ongoing-basis that it can continue to operate safely.
The operation of a facility will typically incorporate wide safety margins to account for the uncertainty in the condition of assets. By removing this uncertainty through real-time condition monitoring, the operation of the facility can be optimized to increase throughput and profitability.
Analysis of the condition monitoring information in combination with operational data can reveal insight into what is adversely affecting asset condition, introducing the possibility of de-bottlenecking and further optimization of the facility processes.
The GUL Monitoring System is unique in that it offers a combination of multi-point wall thickness measurement (8 points circumferentially rather than just a single point which is typical of other commercially available pipe condition monitoring sensors) and large area monitoring of tens of metres of pipe on either side of the sensor location (which no other commercially available sensor offers). This combination represents unparalleled value in terms of the information delivered relative to the cost of the system.
The GUL Monitoring System is also unique in the method that it uses to measure the wall thickness which will continue to robustly report the wall thickness even if the internal surface of the pipe becomes rough due to the corrosion mechanism. Other technologies will struggle to maintain accuracy under such conditions, and will tend to inaccurately report the wall thickness or fail to measure the thickness at all.
The GUL Monitoring System offers a turnkey solution to provide all the information that an asset-owner requires to have confidence in the condition of their pipes. It is a complete offering, from the sensors on the pipes, through the electronics that gather data autonomously, to the Monitoring Studio that presents pipe condition information. This is combined with a proven training infrastructure to ensure personnel capability, and direct access to GUL’s services and support expertise.
The gPIMS® sensor is at the heart of the GUL Monitoring System. gPIMS® stands for guided-wave permanently installed monitoring sensor. Since GUL launched the gPIMS® sensor, the generic term PIMS has become synonymous with any type of permanently installed sensor that is used to monitor the condition of a structure.
There are various strategies of carrying out non-destructive evaluation of an asset:
Inspection is normally defined as a one-off event in order to evaluate the condition of a pipe/structure at a point in time.
Repeat inspection is typically the result of a risk-based inspection (RBI) strategy. RBI is concerned with finding the optimum inspection intervals in order to mitigate risks of failure by reducing their probability. As such, the intent of the repeat inspection is to confirm again that the condition of the pipe/structure is acceptable or to plan maintenance based on this last inspection. There is no emphasis on comparing the repeat inspection to previous results and for this reason, there is typically no effort to use permanently installed sensors, which would allow a better comparison.
Scheduled monitoring is distinguished from repeat inspection by the fact that typically a permanently installed sensor is used for improved comparison between tests carried out in certain scheduled intervals, allowing the operator not only to make an assessment at the time of the repeat test, but also look for changes and to quantify those changes. There is some overlap with repeat inspection in that a sensor can be installed simply to save costs incurred by access to the pipe/structure for repeat inspection. Therefore, we use the term inspection where there is no intention/possibility to compare new data with previous data, and the term monitoring where it is.
Automated monitoring on the other hand can be well defined as a quasi-continuous process of collecting data where the emphasis is on data comparison enabling tracking and trending. The intervals between tests here are not necessarily the result of an RBI strategy but are typically selected by GUL with a view to improving the quality of the results and according to the overall timeframe within which the corrosion rate is to be determined. This type of monitoring can inform actions for improved predictive maintenance and help making operational decisions.
Terminology is important when discussing accuracy of wall thickness measurement. Accuracy is how close a set of thickness measurements are to the true value of wall thickness. This is not to be confused with precision, which is how close the thickness measurements are to each other. For the GUL Monitoring System the accuracy is better than 0.03mm (1.2mils) and the precision on a smooth surface will typically be 0.1%. The resolution (half of the increment of the least significant digit) is 0.005mm (0.2mils).
GUL Monitoring and GUL Screening both use ultrasonic guided waves that travel along the length of the pipe and are reflected from pipe features. The monitoring approach adopted by the GUL Monitoring System differs from the screening approach in that instead of moving the inspection apparatus from one location to another along a pipe, a single location is chosen (usually a location that is of particularly susceptible to corrosion) and the gPIMS® monitoring sensor is permanently installed at this location. Data can then be collected from this sensor as often as required, and can be compared over time to detect corrosion activity with greater sensitivity than with a screening approach.
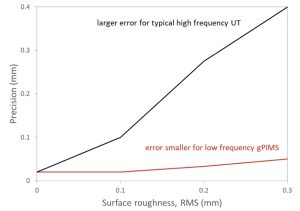
The gPIMS® wall thickness measurement has been designed to be tolerant to surface roughness. Conventional methods of ultrasonically measuring wall thickness encounter difficulties when surface roughness starts to increase as a result of active corrosion. In order to still be able to accurately assess the wall thickness when corrosion develops, the gPIMS® monitoring system uses low frequency guided wave cut-off modes.
The image shows that the precision deteriorates very rapidly for high frequency conventional wall thickness measurement methods as the surface becomes rougher. However, when using the low frequency method employed by the GUL Monitoring System the precision remains excellent, even as the surface becomes very rough.
The GUL Monitoring System can measure the pipe wall thickness on pipes with a thickness as low as 3mm and as high as 50mm.
The more often data is collected, the more sensitive the system becomes to the onset of corrosion activity. Manual data collection would typically be performed every 2-4 weeks. GUL also offers a range of automatic data collection hardware that are battery or solar powered. This means that data can be collected daily or every few hours providing the greatest level of corrosion sensitivity.
Changes in the temperature of the pipe have a substantial effect on the signals that are measured by the sensor. Historically, these changes due to temperature can sometimes be mistaken for corrosion activity. GUL has developed a sophisticated method to suppress changes due to temperature in order to highlight changes due to corrosion. The method relies on having frequently collected data (which means autonomous data collection hardware) in order to capture information about how the pipe responds to a wide range of temperatures. This understanding is then subsequently used to suppress the variations due to temperature to reveal corrosion activity.
The defect detection sensitivity with large area monitoring improves substantially relative to what can be achieved with a screening approach, thanks to the ability to compare many signals through time. A sensitivity of between 0.5 and 1% CSC has been demonstrated in an independent blind trial. This compares very favourably with a typical sensitivity of 5% CSC with GUL Screening.
It is worth noting that the sensitivity of any single datafile depends on the signal-to-noise ratio (SNR) level, which is related to the condition of the pipe (a pipe in good condition will have a better SNR than a generally corroded pipe). The sensitivity to change when monitoring then also depends on how repeatable the signals from the pipe are. If there is a lot of ambient noise, for example, this will cause repeated signals to have a lot of variation which will reduce the sensitivity in detecting the onset of corrosion.
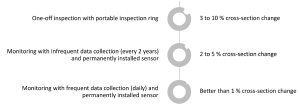
You can select to collect data manually using a Wavemaker® or automatically using a Field Control Unit(FCU). For the manual option the frequency of data collection would be limited by how often personnel are able to access the site; manual collection is typically performed every 2 weeks to every 3 years. For the automatic option the frequency of data collection may be limited by the battery life of the instrument, so that in order to preserve the battery for 3 years you would configure the unit to collect every 2 days. If a solar panel is installed, then collections can be more frequent. The advantage of collecting data as often as possible is the increased sensitivity to the onset of change in the pipe as shown in the image. The sensitivity of the first row with GUL Screening is between 3 and 10% cross-section change (CSC). With manual data collection every 2 years, this sensitivity improves to between 2 and 5% CSC. However, with automatic daily data collection the sensitivity attained is better than 1% CSC.
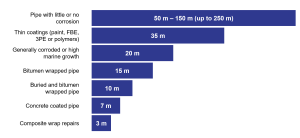
In ideal circumstances, the test range can be more than 200 meters (656 feet) in each direction. However, this may not always be the case as the inspection range can be limited by attenuation due to pipeline properties (coatings, surrounding environment and existing pipe metal condition) or features such as bends or flanges.
The figure below provides the typical inspection range achieved with GUL Monitoring under a variety of pipe conditions.
It is possible to inspect past one bend with GUL Screening, however, the sensitivity deteriorates after the bend due to the disruption to signals caused by the bend geometry. For GUL Monitoring, there is an advantage that signals can be compared to one another through time, so that an improved level of sensitivity can be achieved past the bend with a monitoring approach than with a screening approach.
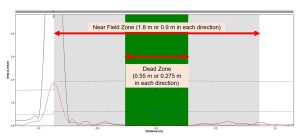
Yes the GUL Monitoring system uses the same excitation method as for GUL Screening, and as such is subject to the same limitations with the dead-zone and near-field.
The dead zone is indicated by the green area in the A-scan. Data is not available in this area because the transducers are still transmitting the signal and not receiving any (pulse-echo configuration).
The near field zone is the gray area next to the dead zone in the A-scan. Data is available in this region, but should not be used for defect detection because the system is transitioning from a transmit to a receive mode, which affects the received amplitudes.
The size of the dead zone and near field zone are a affected by the frequency of the guided wave signal (higher frequencies = smaller zones). It can be estimated that the length of dead zone and near-field zone are 0.275 m (1 foot) and 0.9 m (3 feet) per sensor direction respectively.
Whenever there is a high cost to access the pipe for inspection, it is economically sensible to install a GUL Monitoring System, as doing so means that future access costs can be avoided through collecting data from the gPIMS® sensor instead of accessing the pipe and doing an inspection. Such access conditions would include when there is a requirement for: excavation, scaffolding, insulation removal, or travel to an offshore location. In addition other suitable applications would be when there is a risk to the safety of personnel due to hazardous atmospheres, extreme temperatures, heights, or confined entry.
Another excellent application for GUL Monitoring would be for applications with a high risk of degradation to the pipe. Whether this risk is due to high likelihood or high consequence, being able to regularly monitor the condition of an entire volume of a pipeline along tens of metres gives assurance that degradation would be detected before it can progress. When this large area monitoring capability is combined with the 8 wall thickness readings at the sensor location, the GUL Monitoring System is robust to the detection of both uniform and localized corrosion mechanisms.
Yes. The GUL Monitoring System has a range of products that have been certified for installation in explosive atmospheres. The system will operate as normal, automatically collecting data from the pipe, when installed in a Zone 0 classified area.
Yes. Please contact us for further details about this application.
The range of pipe sizes that can be monitored with the GUL Monitoring Systems is from 3” to 72”. Other pipe sizes outside of this range may be possible subject to discussion with GUL.
The range of pipe thicknesses that can be monitored is from 3mm to 50mm wall thickness.
GUL Monitoring can be applied to both seamless and seamed (spiral or longitudinally welded) pipes, made from the following materials:
· Carbon steel
· Galvanized steel
· Copper
· Stainless steel
· Cast Iron
· Ductile Iron
· Duriron
· Other metals (platinum, titanium)
Here is a non-exhaustive list of pipes that GUL Monitoring is applicable to:
· ANSI / API 5L: X42 – X120 pipes for pipelines
· ASTM A53 / ASME SA53 carbon steel pipe
· ASTM A106 / ASME SA106 carbon steel pipe
· ASTM A135/ ASME SA-135 Electric-Resistance-Welded (ERW) Steel Pipe
· ASTM A312 Stainless Steel Pipe (e.g. 304/304L and 316/316L)
· ASTM A790 Duplex and Super Duplex Pipe (e.g. UNS S32205/31803 and UNS S32750/32760)
· ASTM A335 Alloy Pipe (e.g. P11, P22 and P91)
Contact GUL for advice for pipes made from:
· Polyvinylchloride (PVC)
· CPVC
· Polypropylene
· Polyvinylidene fluoride (PVDF)
· PEX (polyethylene cross-linked)
· Borosilicate glass
· Fiberglass reinforced plastic (FRP)
Yes, GUL Monitoring is well suited for installation on buried pipes. Many gPIMS® sensors have been installed on buried pipes to-date.
Yes, the detection of corrosion under insulation was one of the primary motivations for the original development of guided wave testing. By permanently installing a gPIMS® sensor under the insulation, repeat inspections can quickly and easily be performed without disturbing the insulation or cladding, and risking creating a path for water ingress.
Yes, several GUL Monitoring Systems have been installed on offshore platforms to monitor risers, which are typically difficult to access, and so are well suited applications for this equipment.
A pre-installation test, with GUL Screening equipment, is required in order to verify that the pipe can be inspected with guided waves, and in order to optimise the location for the permanently installed gPIMS® sensor.
Following this, the surface of the pipe should be prepared, which would typically involve grit-blasting the surface to Sa2.5. However, some paint coatings (e.g. fusion-bonded epoxy that are in good condition (verified by the pre-installation test) can remain in place.
The gPIMS® sensor is then installed by applying a 2-part epoxy to the transducers and then tightening the sensor closing mechanism to secure the sensor onto the pipe. A test is conducted at this stage to ensure the transducers are making good contact with the pipe all the way around.
The gPIMS® sensor is then environmentally sealed using polyurethane sealant, and the cable is then connected permanently and sealed in place.
The apparatus for data collection is then installed. This could be an access port for periodic manual data collection, or it could be an autonomous battery or solar powered instrument that will automatically collect data on a more frequent basis.
Data is uploaded to the GUL Monitoring Studio where the user can login to view the files that have been collected, the wall thickness values around the pipe at the sensor location through time, and the large area monitoring results.
The operating temperature range of the gPIMS® sensor, that is installed on the pipe, is-40° to +130°C (-40°F to 266°F). Due to the adhesives that are used during installation, the upper temperature limit is 70°C (158°F) during installation of the gPIMS® sensor.
The pre-installation test will inform whether any existing coating can remain in place. Typically fusion-bonded epoxy up to 1mm in place can remain in place, and provides an ideal coating upon which to install the gPIMS® sensor. Coatings that are poorly adhered or in otherwise poor condition require removal, through grit-blasting the surface to Sa2.5.
The gPIMS® sensor is low profile requiring only 25mm (1inch) of radial clearance, e.g. between pipes in a rack, to be installed. Where the cable connects to the sensor (which is at the 3 o’clock position) an additional clearance of 75mm (3inch) is required.
The GUL Monitoring Studio is an online data visualization platform that allows users to view and interact with all the data from their sensors. The wall thickness data collected from a sensor can be viewed on the Studio in an interactive graph with: zooming, channel-selection, data labels, and download in image or spreadsheet format.
The large area monitoring data for a sensor can also be viewed in an interactive graph showing several different visualisations that allow insights to be readily drawn.
All sensor data that is uploaded to the Studio will be archived on the platform in a timeline view (along with other associated files, such as photos and installation reports) and be available for future download.
The files collected by the GUL Monitoring System can be opened and analysed in WavePro™ just like with GUL Screening files. The WavePro™ software has some special tools available to facilitate working with GUL Monitoring files: two or more files can be compared to one another, and subtracted, to reveal changes.
The wall thickness values are not available to view in WavePro™ as these are processed on the GUL Monitoring Studio rather than in WavePro™.
The Level 2: Pipe Monitoring (L2:PM) training course provided by GUL Training is required in order for an inspector to be qualified to install a gPIMS® sensor as part of a GUL Monitoring System. Please see the GULT section of the website for the latest training course schedule.


